
To install and configure Prometheus and Grafana on Ubuntu, start by updating your package lists and installing Prometheus. You can do this by adding the Prometheus repository and running apt-get install prometheus. Next, configure Prometheus by editing its configuration file to include the targets you want to monitor. After Prometheus is set up, install Grafana by downloading the latest .deb package from the Grafana website and installing it with dpkg -i. Once Grafana is installed, access its web interface and add Prometheus as a data source. Finally, create dashboards in Grafana to visualize the metrics collected by Prometheus.
How to Download and Install Prometheus– Ubuntu
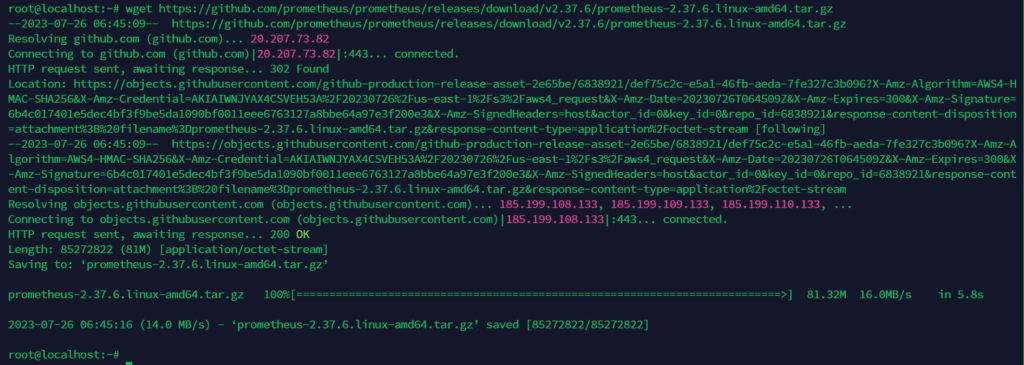
First, we are going to install Prometheus on our monitoring Linux server.
wget https://github.com/prometheus/prometheus/releases/download/v2.37.6/prometheus-2.37.6.linux-amd64.tar.gz
then extract the Prometheus zip file
tar -xvfz prometheus-*.tar.gz
now Create two directories for Prometheus to use
mkdir /etc/prometheus /var/lib/prometheus
go to the downloaded Prometheus directory
cd prometheus-2.37.6.linux-amd64
and move Prometheus and promtool directories into /usr/local/bin/
mv prometheus promtool /usr/local/bin/
move the prometheus.yml, consoles, and console_libraries into the /etc/prometheus/
mv prometheus.yml console* /etc/prometheus/
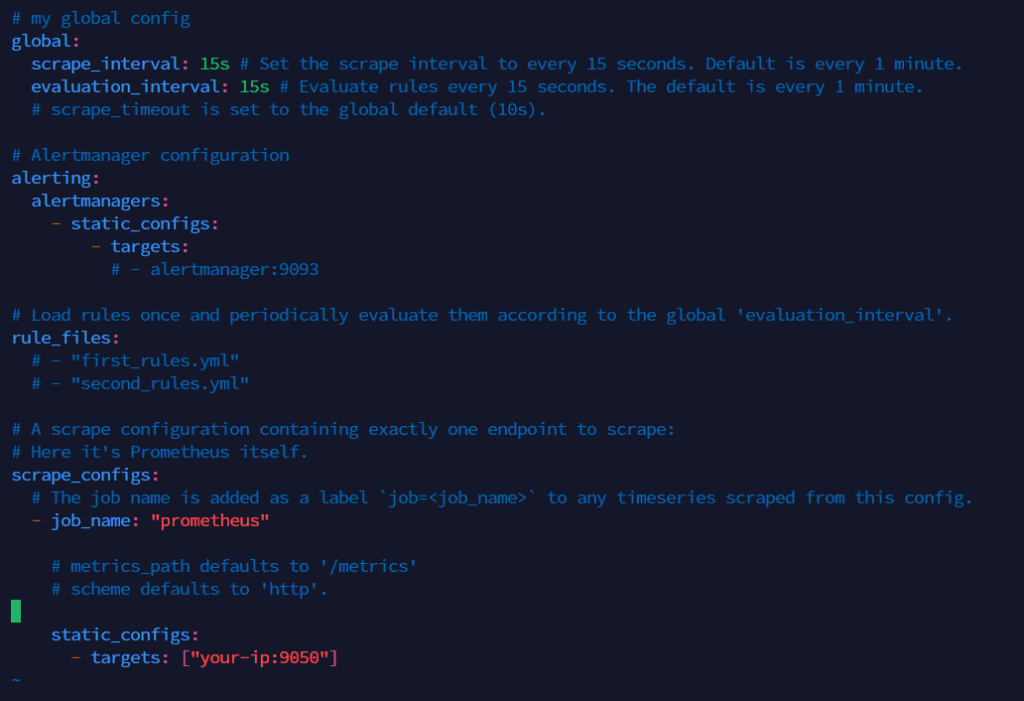
Edit the prometheus.yml file and change localhost:9050 with your-ip:9050
Verify our Prometheus is successfully installed
prometheus --version
How to Configure Prometheus
Create a Prometheus user with the following command:
useradd -rs /bin/false prometheus
create a Prometheus service file with the following command:
vim /etc/systemd/system/prometheus.service
edit with the following content
[Unit]
Description=Prometheus
Wants=network-online.target
After=network-online.target

[Service]
User=prometheus
Group=prometheus
Type=simple
Restart=on-failure
RestartSec=5s
ExecStart=/usr/local/bin/prometheus \
    --config.file /etc/prometheus/prometheus.yml \
    --storage.tsdb.path /var/lib/prometheus/ \
    --web.console.templates=/etc/prometheus/consoles \
    --web.console.libraries=/etc/prometheus/console_libraries \
    --web.listen-address=0.0.0.0:9050 \
    --web.enable-lifecycle \
    --log.level=info

[Install]
WantedBy=multi-user.target
give ownership to Prometheus directories
chown -R prometheus: /etc/prometheus /var/lib/prometheus
reload daemon with the following command:
systemctl daemon-reload
Enable Prometheus with the following command:
systemctl enable prometheus
start the Prometheus service and check the status with the following command:
systemctl start prometheus
systemctl status prometheus
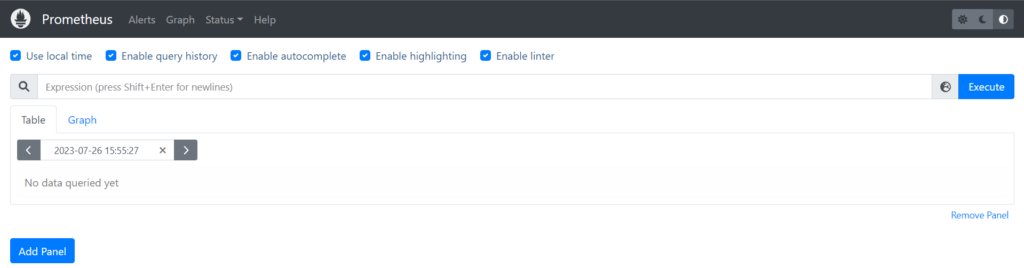
Access the Prometheus web interface with the following URL:
http://local_ip_addr:9050
Replace local_ip_addr with the IP of the monitoring server
now you can see the following interface:
Install and Configure the node_exporter on client-server
download the node_exporter file on client-server
wget https://github.com/prometheus/node_exporter/releases/download/v1.5.0/node_exporter-1.5.0.linux-amd64.tar.gz
Extract the file
tar -xvfz node_exporter-*.tar.gz
move node_exporter file to /usr/local/bin
mv node_exporter-1.5.0.linux-amd64/node_exporter/usr/local/bin
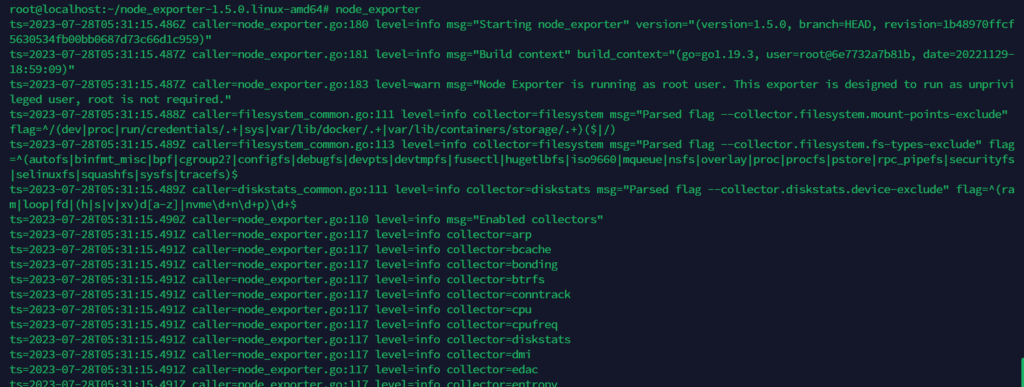
run the Node Exporter using the following command on the screen:
screen -R
node_exporter
now you can see the following:
create a node_exporter user
useradd -rs /bin/false node_exporter
create a service file for node_exporter.service
vim /etc/systemd/system/node_exporter.service
[Unit]
Description=Node Exporter
Wants=network-online.target
After=network-online.target

[Service]
User=node_exporter
Group=node_exporter
Type=simple
Restart=on-failure
RestartSec=5s
ExecStart=/usr/local/bin/node_exporter

[Install]
WantedBy=multi-user.target
create the symlink of node_exporter with the following command:
systemctl enable node_exporter
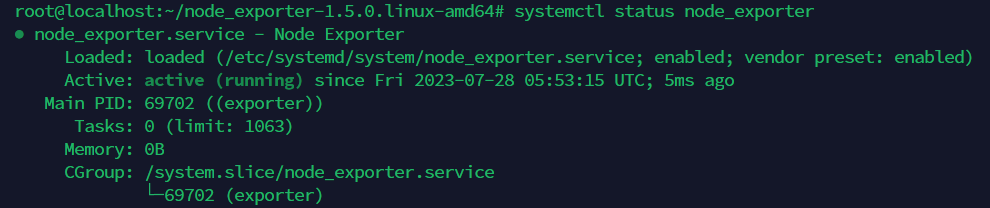
activate the service with the following commands:
systemctl daemon-reload
systemctl restart node_exporter
systemctl status node_exporter
Configure Prometheus to Monitor Client Nodes
go to the monitoring server and open prometheus.yml to configure the client
vim /etc/prometheus/prometheus.yml
and add the following details:
...
- job_name: "remote_collector"
  scrape_interval: 10s
  static_configs:
    - targets: ["remote_addr:9100"]
restart the Prometheus service
systemctl restart prometheus
now go to the Prometheus web interface, click Status and go to Targets
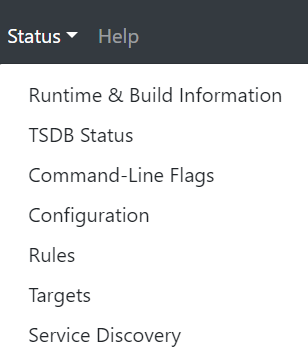
There, you can see both servers are up and running
Install and Configure the Grafana Server
install required packages
apt-get install -y apt-transport-https software-properties-common
Download the Grafana key with the following command:
wget -q -O /usr/share/keyrings/grafana.key https://apt.grafana.com/gpg.key
Add the Grafana stable releases repository
echo "deb [signed-by=/usr/share/keyrings/grafana.key] https://apt.grafana.com stable main" | sudo tee -a /etc/apt/sources.list.d/grafana.lis
Update the apt packages
apt-get update
Install the Grafana
apt-get install grafana
Reload the daemon
systemctl daemon-reload
start and enable the Grafana server
systemctl enable grafana-server
systemctl restart grafana-server
check the status of the Grafana server
systemctl status grafana-server
How to Integrate Grafana and Prometheus
Open the Grafana web interface with 3000 port
http://remote-server-ip:3000
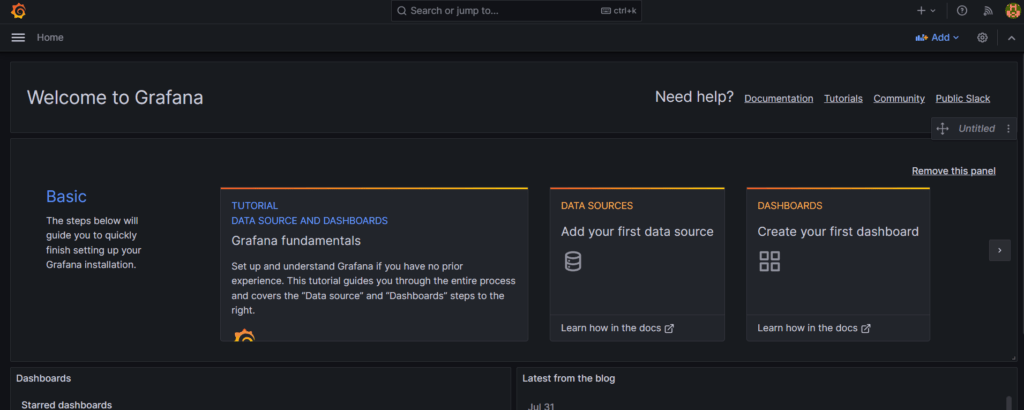
now you can see the following interface:

fill in the default user and password is admin and then set a new password
now you can see the following interface:
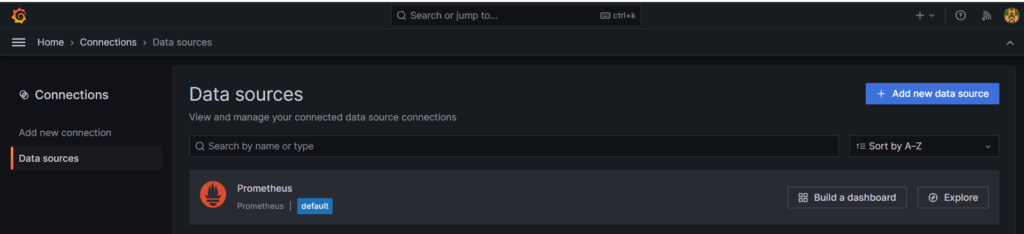
click on ≡ three-line symbol, then go to Connection and click on Data sources
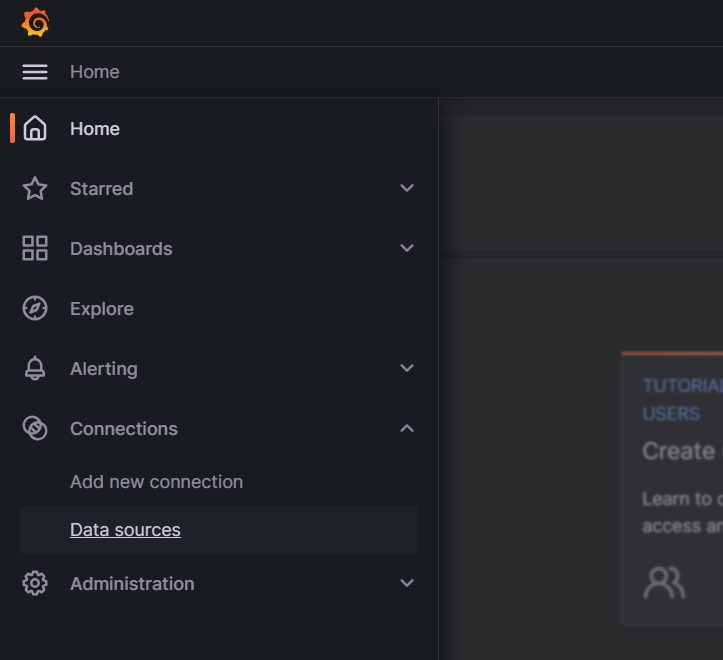
click on Prometheus
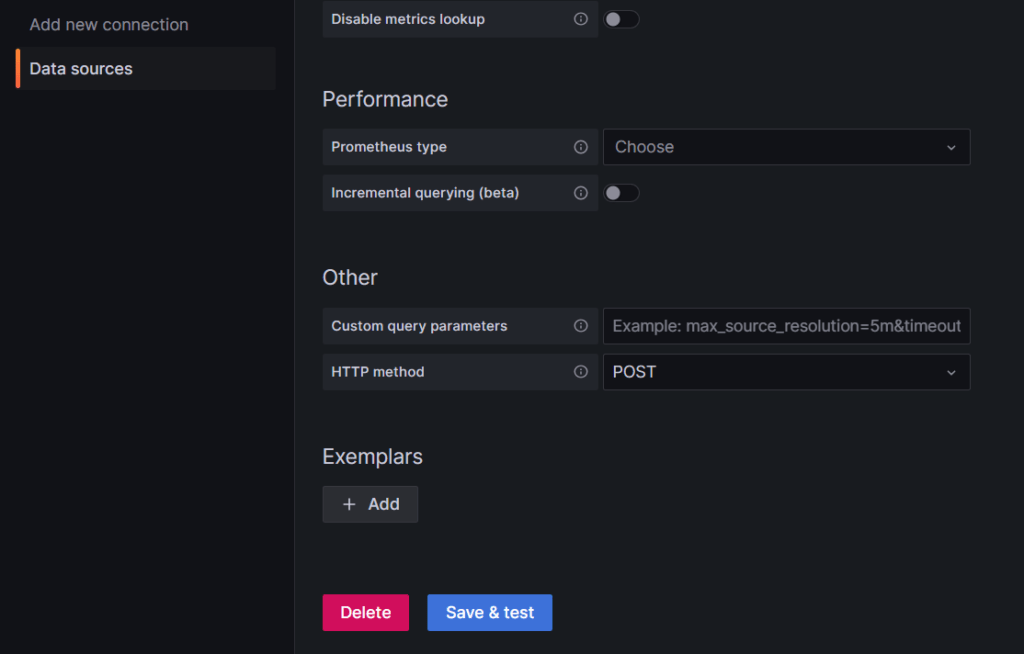
Fill the details
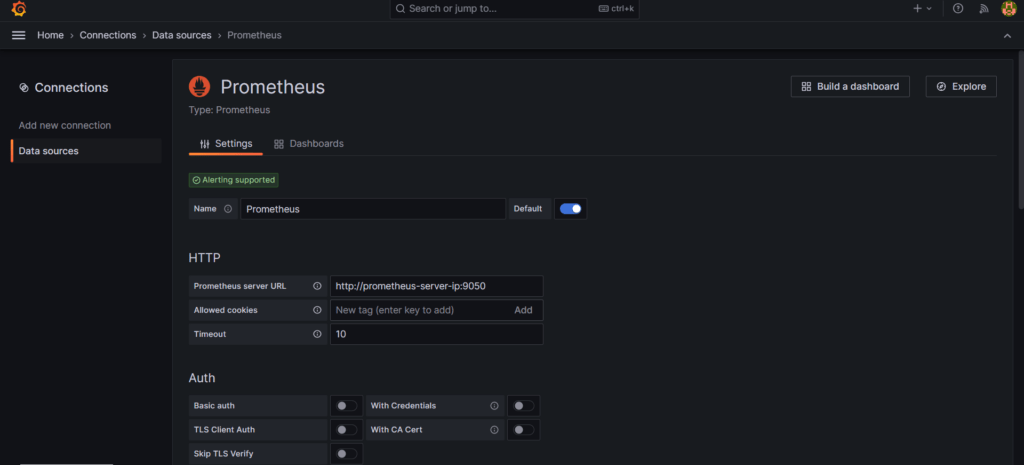
then click on save and test
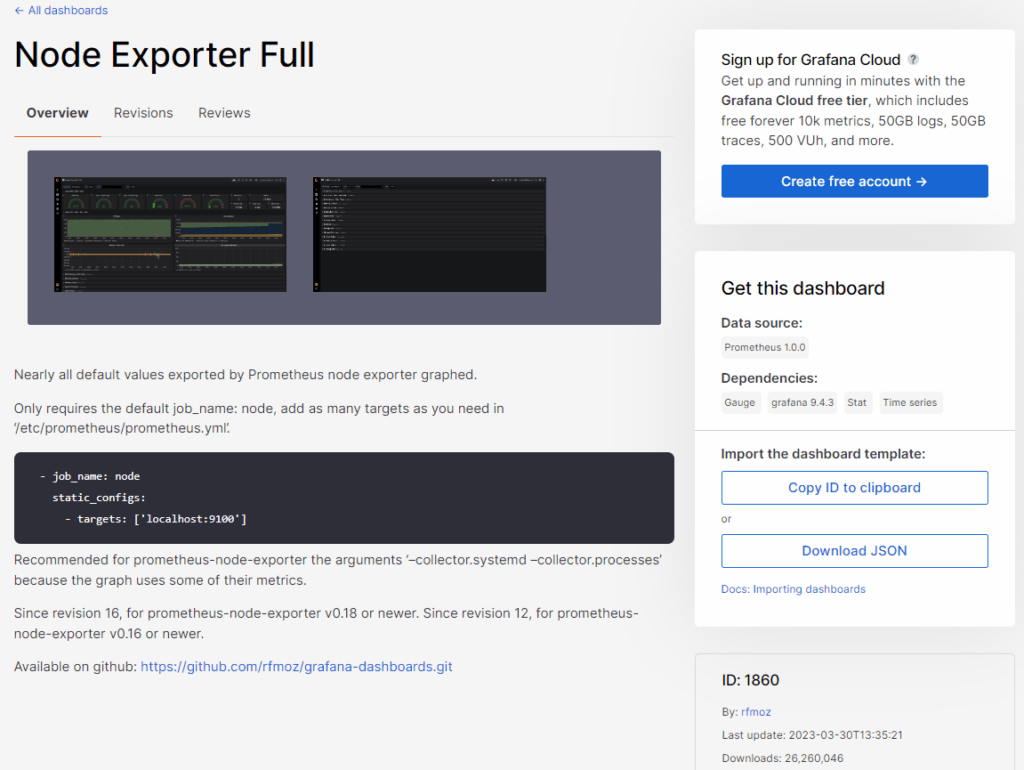
How to Import a Grafana Dashboard
Visit the Grafana Dashboard with the following link:
https://grafana.com/grafana/dashboards
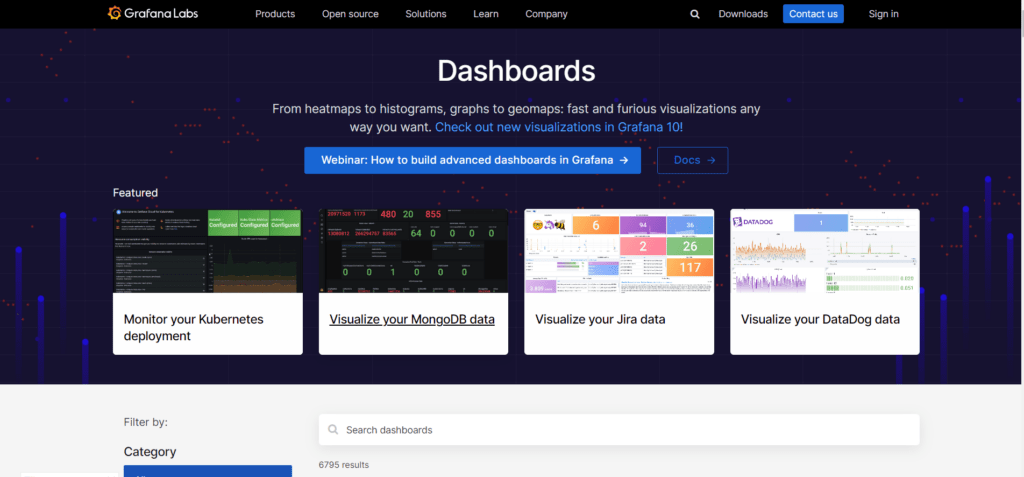
then search Node Exporter in the search box and click on Node Exporter Full

then copy the ID
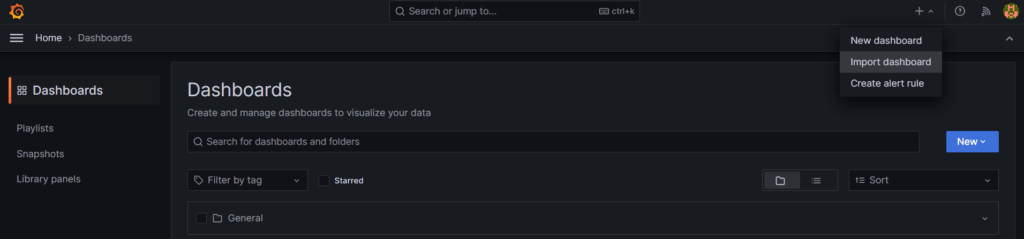
go to the home page and click on the + icon, then click on Import dashboard
paste copied ID in Import via grafana.com and click on load
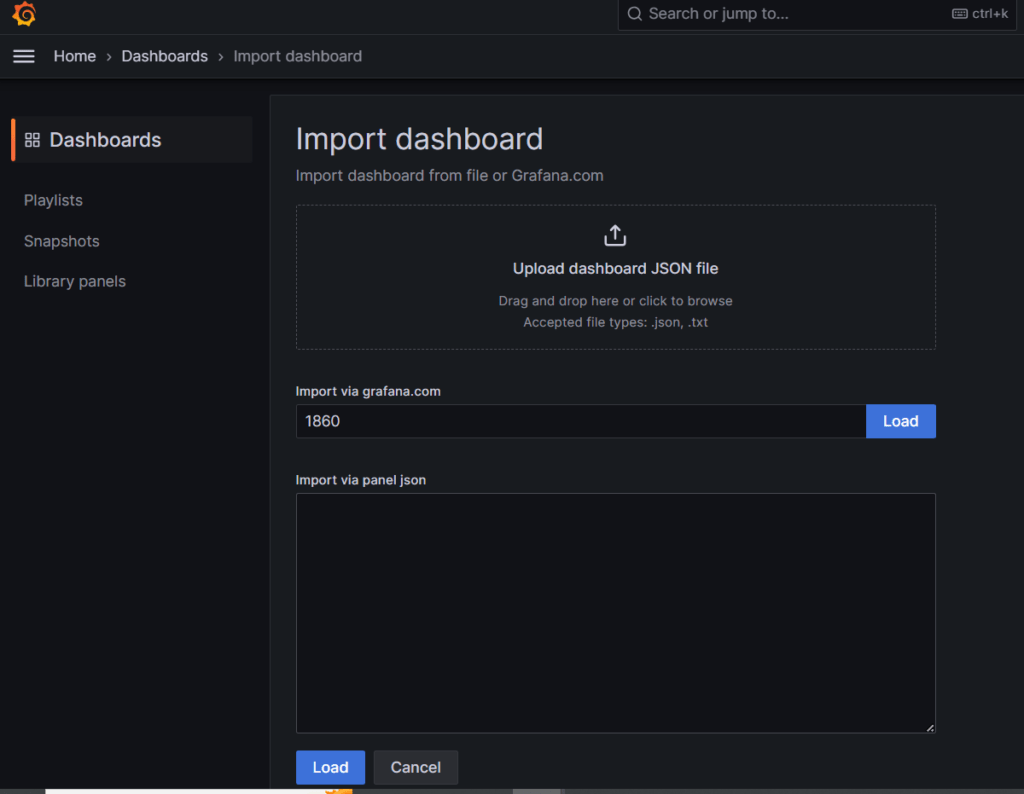
Then choose Prometheus as the data source and click the Import button
Now you can see Grafana displays the performance metrics and state of the client node, including the memory, RAM, and CPU details.
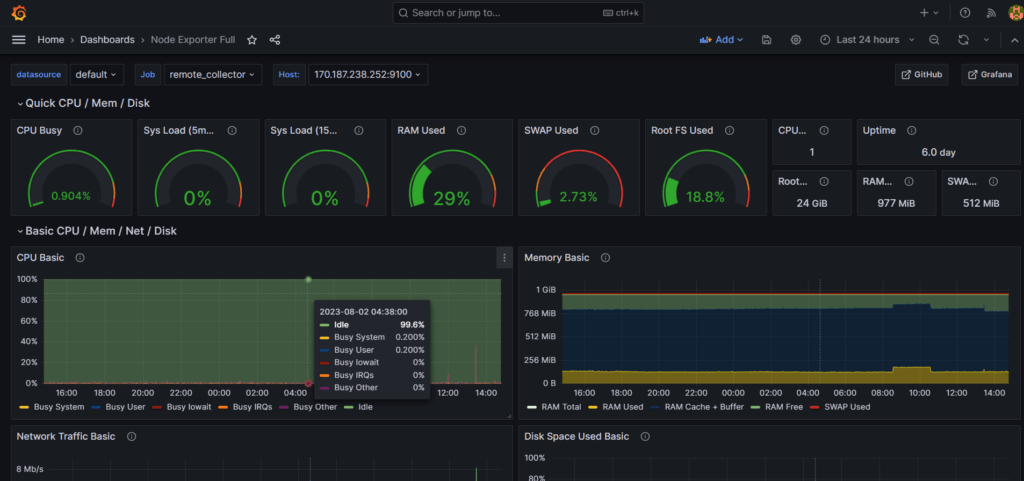
Same the following steps you can configure many clients on this tool and monitor them.
Read Also:
Configure Squid Proxy On Ubuntu 20.04
Find Us on Socials